Monte Carlo simulation, a powerful computational technique, finds wide application in finance for modeling uncertainty and risk assessment. In essence, it uses random sampling to generate numerous possible outcomes for a financial model, allowing for a more robust and probabilistic understanding of potential results.
Excel, while not the most sophisticated platform for Monte Carlo simulations, offers a readily accessible environment for basic applications. It leverages built-in functions and the ability to create macros to perform the necessary calculations. The core principle involves defining the uncertain input variables within your financial model and assigning them probability distributions. These distributions, such as normal, uniform, or triangular, reflect the range of possible values and their likelihood.
For example, in a discounted cash flow (DCF) model, key inputs like revenue growth rate, discount rate, and operating expenses can be treated as uncertain variables. Instead of using single point estimates, you would define probability distributions for each. Excel functions like `RAND()` (for generating uniform random numbers) and `NORM.INV()` (for generating normally distributed random numbers) are crucial for sampling values from these distributions.
The next step involves building your financial model in Excel, referencing the randomly generated input values. Each calculation of the model, using one set of randomly drawn input values, represents a single ‘simulation’ or ‘trial.’ To obtain a statistically significant result, you need to run the simulation thousands of times. This is typically achieved using Excel’s data table feature or through VBA (Visual Basic for Applications) macros, automating the repetitive calculations.
After running the simulations, you analyze the resulting distribution of the output variable you are interested in, such as net present value (NPV), internal rate of return (IRR), or portfolio return. Excel provides tools for this analysis, including histograms, descriptive statistics (mean, standard deviation, percentiles), and charting capabilities. This analysis allows you to estimate the probability of different outcomes, such as the probability of a negative NPV or a return below a certain threshold.
While Excel offers a convenient entry point, it has limitations. It can be slow for complex models with many uncertain variables or a large number of simulations. Specialized Monte Carlo simulation software packages offer better performance, more advanced features (e.g., correlation modeling, sensitivity analysis), and more sophisticated statistical analysis tools. However, for basic risk analysis and understanding the principles of Monte Carlo simulation, Excel provides a valuable and accessible starting point for finance professionals.
 1280×720 monte carlo simulation spreadsheet monte carlo simulation from db-excel.com
  1024×929 montecarlo excel maven from www.excelmaven.com
 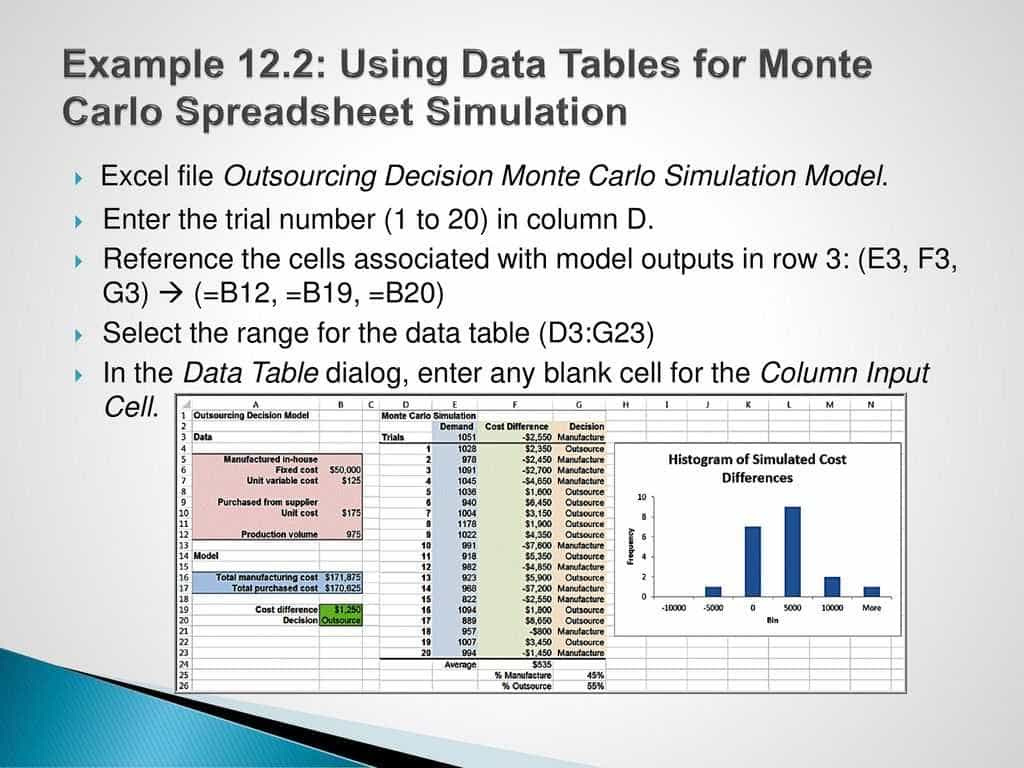 1024×768 monte carlo simulation spreadsheet monte carlo simulation excel from db-excel.com
 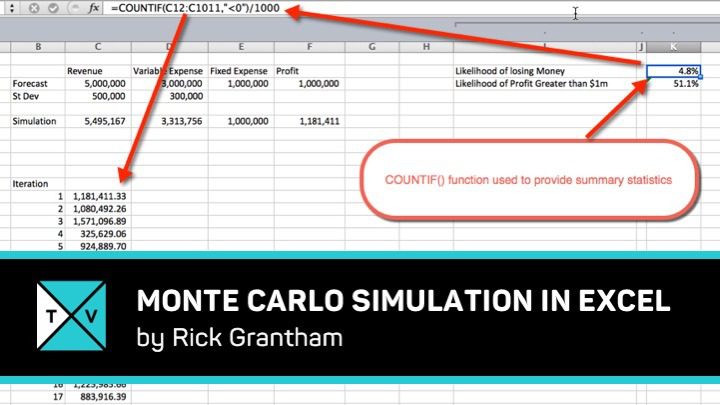 720×405 monte carlo simulation formula excel tutorial excel tv from excel.tv
  790×513 monte carlo simulation excel marketxls add formulae from marketxls.com
  1920×910 monte carlo simulation excel model eloquens from www.eloquens.com
  880×594 monte carlo simulation excel eloquens from www.eloquens.com
  1920×908 monte carlo simulation excel template eloquens from www.eloquens.com
  554×551 monte carlo simulation excel formula tutorial from excel.tv
 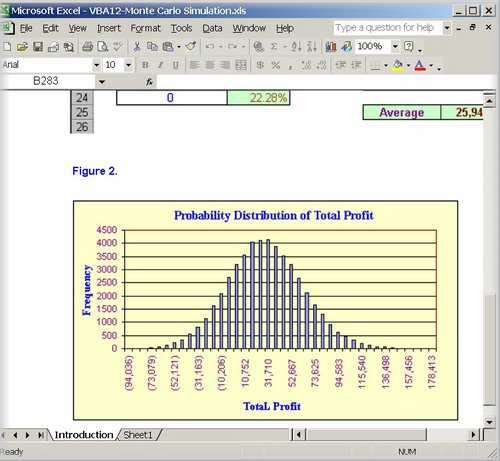 500×461 excel monte carlo simulation from www.ozgrid.com
  1700×817 investment return monte carlo simulation excel model template eloquens from www.eloquens.com
  720×540 monte carlo analysis macros excel model eloquens from www.eloquens.com
  707×531 monte carlo simulation ipad ibook from financetrainingcourse.com
  1011×568 monte carlo simulation excel models instant downloads eloquens from www.eloquens.com