WPF Google Finance Chart
Creating interactive financial charts in WPF (Windows Presentation Foundation) can significantly enhance your desktop applications. While WPF doesn’t offer a built-in charting control equivalent to Google Finance, we can leverage WebBrowser control and Google Finance’s embedded chart functionality to achieve a similar outcome.
Approach
The core idea is to embed a Google Finance chart within your WPF application using the WebBrowser control. We’ll construct a URL that points directly to the chart of a specific stock symbol. The WebBrowser control will then render this URL, effectively displaying the Google Finance chart within your WPF application window.
Implementation Steps
- Add the WebBrowser Control:
In your WPF XAML file, add a
WebBrowsercontrol. Give it a suitable name, like ‘MyWebBrowser’. You can control its size and position within your layout.<WebBrowser x:Name="MyWebBrowser" /> - Construct the Google Finance Chart URL:
Google Finance chart URLs follow a pattern. You need to replace the placeholders with the appropriate information. A basic URL looks like this:
"https://www.google.com/finance/chart?q=NASDAQ%3AAAPL&espv=2&output=interactive"*
q=NASDAQ%3AAAPL: Specifies the stock symbol. In this example, it’s Apple (AAPL) on the NASDAQ exchange. You’ll need to URL-encode the colon (:) as %3A. *espv=2: Ensures a modern display. *output=interactive: Renders an interactive chart allowing user interaction.You can dynamically construct this URL in your C# code using a string builder or string formatting, allowing you to change the stock symbol based on user input or other application logic.
- Load the URL in the WebBrowser Control:
In your C# code behind, navigate the
WebBrowsercontrol to the constructed URL.MyWebBrowser.Navigate(new Uri(chartUrl));Replace
chartUrlwith the URL string you constructed. - Handle Security Considerations:
The
WebBrowsercontrol operates with Internet Explorer’s settings. You might need to adjust security settings in Internet Explorer to allow scripts and active content for Google Finance to display correctly. However, use caution and consider the security implications before lowering security settings too much. - Interaction and Customization:
The displayed chart is Google Finance’s interactive chart. Users can zoom, pan, and view historical data directly within the
WebBrowsercontrol. Customization beyond the default Google Finance options is limited, but you can explore URL parameters for different chart types (line, candlestick, etc.) and timeframes.
Advantages
- Ease of Implementation: Relatively simple to implement compared to creating a charting control from scratch.
- Interactive Chart: Leverages Google Finance’s interactive charting capabilities.
- Up-to-Date Data: Displays real-time (or near real-time) data from Google Finance.
Disadvantages
- Dependency on Google Finance: Relies entirely on Google Finance’s service. Changes or outages on their end will affect your application.
- Limited Customization: You are restricted to the customization options provided by Google Finance.
- Security Concerns: May require adjustments to Internet Explorer’s security settings.
- UI Integration: Embedding a web page in WPF can sometimes feel disjointed from the rest of the native application.
Alternatives
If you require greater control and customization, consider using dedicated WPF charting libraries, such as Telerik UI for WPF, SciChart, or Dynamic Data Display. These libraries offer powerful charting features but require more development effort.
 1125×855 wpf chart component fast scientific engineering charts from www.gigasoft.com
  470×300 wpf chart control telerik ui wpf from www.telerik.com
 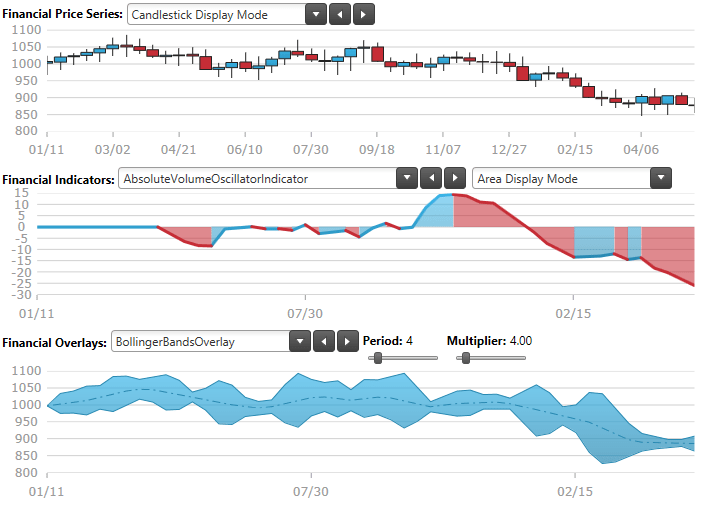 706×507 gallery financial series data chart wpf from www.infragistics.com
 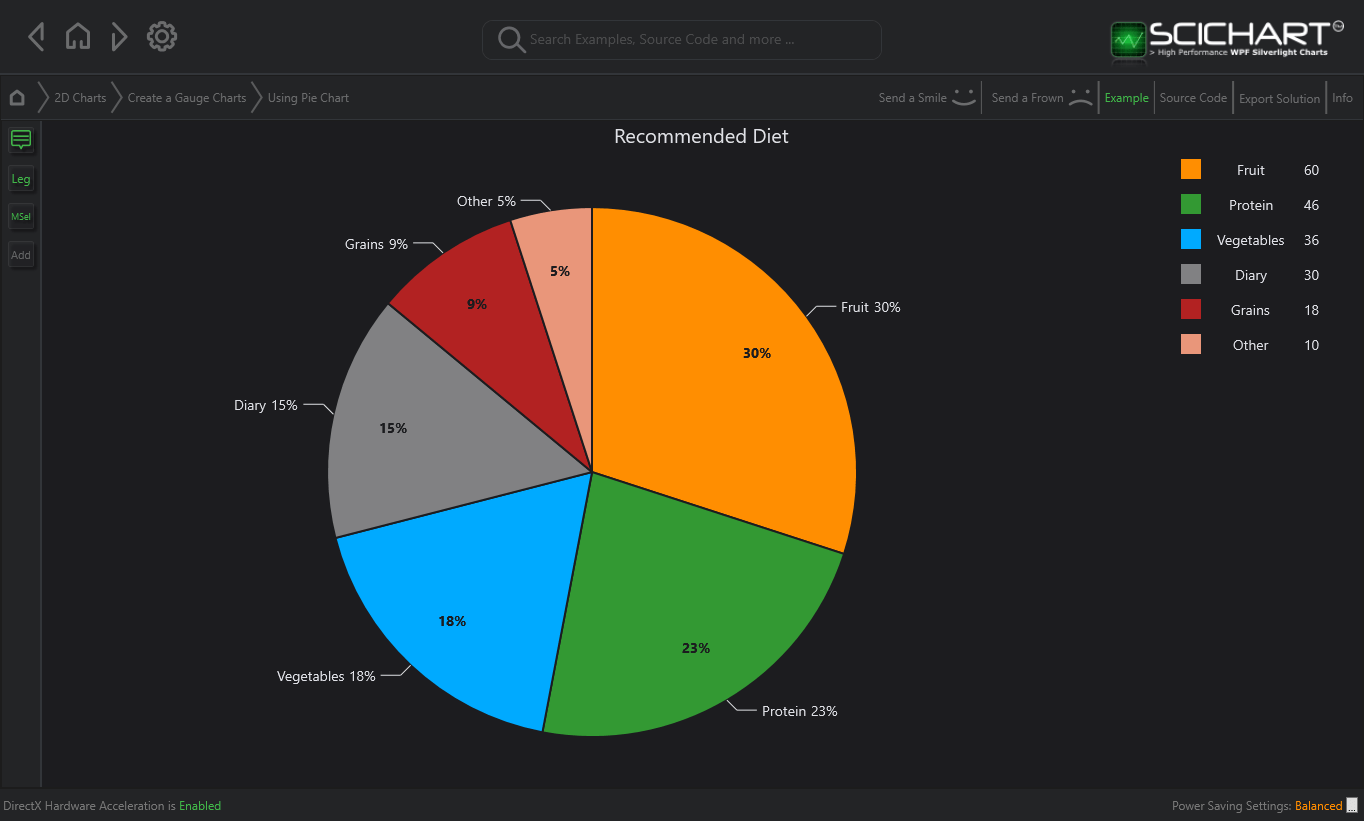 1364×821 wpf pie chart fast native charts wpf from www.scichart.com
  804×604 creating real time wpf chart fast native chart controls wpf from scichart.com
 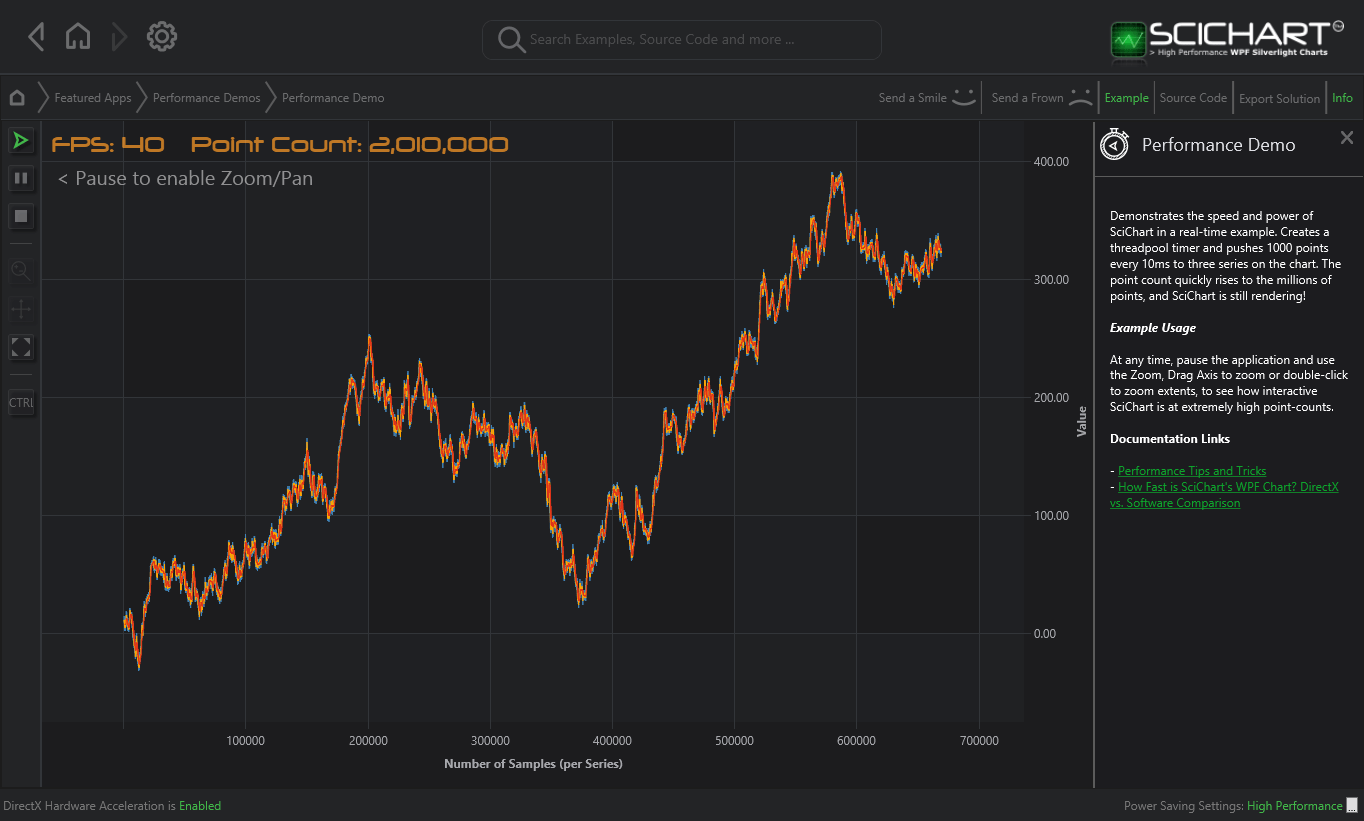 1364×821 wpf chart realtime performance demo fast native charts wpf from www.scichart.com
  814×375 infragistics ultimate ui wpf financial chart from www.infragistics.com
 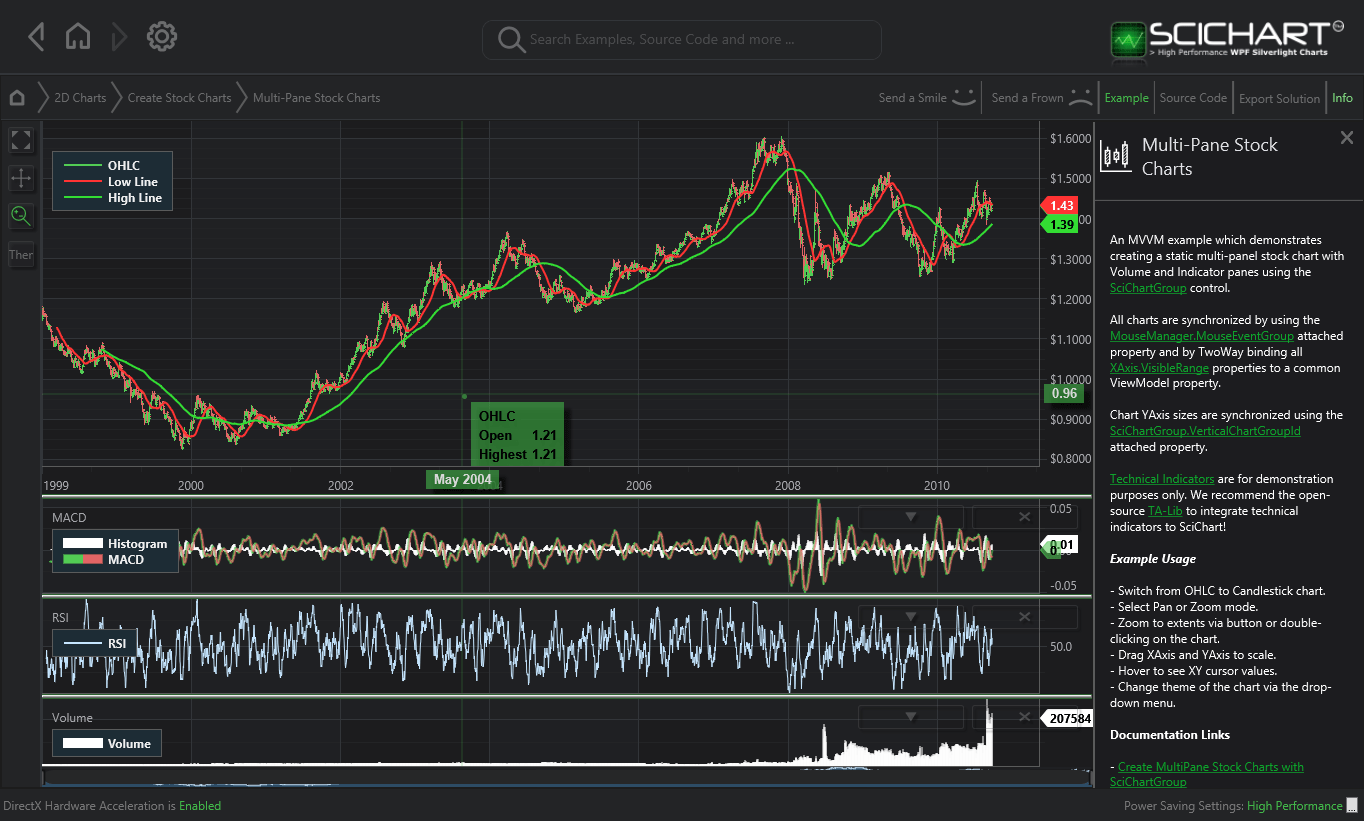 1364×821 wpf multi pane stock charts scichart from scichart.com
  1380×860 wpf realtime ticking stock charts fast native charts wpf from www.scichart.com
  600×338 google finance lets chart portfolio from thenextweb.com
  768×420 wpf ultimate ui wpf application wpf components infragistics from www.infragistics.com