“`html
jQuery and Finance Graphing: A Dynamic Duo
jQuery, though often perceived as “legacy” in modern JavaScript development, still offers convenient tools and plugins for enhancing web applications, particularly when dealing with data visualization. When it comes to finance, presenting stock prices, market trends, and portfolio performance clearly and interactively is crucial. jQuery can be leveraged, often in conjunction with other libraries, to create compelling finance graphs.
Why Use jQuery (with Supporting Libraries)?
While pure JavaScript and modern frameworks like React, Vue, or Angular are prevalent, jQuery’s simplicity and readily available charting plugins provide a quicker route for some projects, especially when legacy codebases are involved or for rapid prototyping. The core benefit lies in jQuery’s ability to easily manipulate the DOM and handle asynchronous data fetching, streamlining the integration of graph libraries.
Common Libraries for Finance Graphs with jQuery
jQuery itself doesn’t directly create graphs. Instead, it’s used alongside dedicated charting libraries. Here are a few popular options:
- Flot: A lightweight and flexible charting library that integrates well with jQuery. It’s simple to use and customize, making it suitable for basic stock charts and trend lines. It supports features like tooltips, zooming, and panning.
- Chart.js (with jQuery adapter): While primarily used without jQuery, Chart.js has adapters that allow it to be used within a jQuery environment. This provides access to a wide array of chart types, including line, bar, pie, and radar charts, allowing for a more diverse range of financial visualizations. Chart.js is known for its clean look and responsive design.
- Highcharts (with jQuery): A more advanced commercial charting library offering extensive features and customization options. It’s a robust solution for complex financial data, including candlestick charts, OHLC charts (Open-High-Low-Close), and advanced technical indicators. Highcharts requires a license for commercial use.
- jqPlot: Another jQuery plugin specifically designed for creating various types of graphs and charts, including line charts, bar charts, and pie charts. It is relatively easy to use and offers several customization options.
Building a Basic Finance Graph with jQuery and Flot (Example)
Let’s imagine a scenario where you want to display a simple stock price graph using jQuery and Flot. The basic workflow would be:
- Include Libraries: Load jQuery and the Flot library in your HTML file.
- Fetch Data: Use jQuery’s
$.ajaxto retrieve stock price data from an API or a local data source (e.g., JSON file). - Format Data: Transform the raw data into the format required by Flot (typically an array of [timestamp, price] pairs).
- Create the Graph Container: Add an HTML element (e.g., a
<div>) to your page where the graph will be rendered. - Render the Graph: Use Flot’s
$.plot()function, passing in the data and options (e.g., chart type, axes labels, colors) along with the graph container.
Considerations
- Modern Alternatives: For new projects, consider exploring modern charting libraries like D3.js, which offers greater flexibility and performance, even though the learning curve might be steeper. Modern JavaScript frameworks (React, Vue, Angular) also provide powerful components for data visualization.
- Data Handling: Securely handle financial data. Avoid exposing sensitive information and implement proper data validation and sanitization.
- Performance: For large datasets, optimize data fetching and rendering to ensure smooth performance. Consider techniques like data aggregation and caching.
- Responsiveness: Ensure that your graphs are responsive and adapt well to different screen sizes.
In conclusion, while jQuery might not be the first choice for cutting-edge financial visualizations, it remains a viable option when combined with appropriate charting libraries. It allows for rapid development and integration, particularly in existing projects or when dealing with simpler charting requirements. However, for more complex and performance-critical applications, exploring modern JavaScript frameworks and specialized charting libraries is recommended.
“`
 1600×1157 finance graph stock illustration illustration climbing from www.dreamstime.com
  800×600 finance graph sketch freebie supply from freebiesupply.com
  800×534 finance graph stock illustration illustration chart from www.dreamstime.com
  1600×1690 finance graph stock illustration illustration internet from www.dreamstime.com
  600×334 google finance graph website stack overflow from stackoverflow.com
  737×400 jquery graph plugins paid formget from www.formget.com
 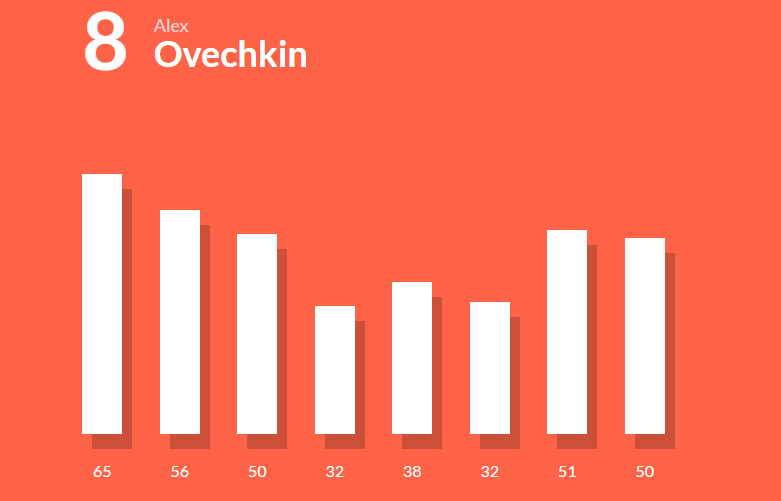 781×501 jquery graph plugins chart plugins wpshopmart from wpshopmart.com
 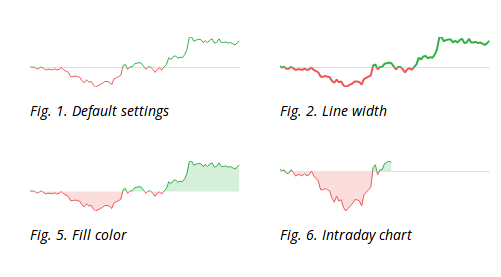 501×277 javascript stock graph library javascript iamrohitin from www.iamrohit.in
  700×500 github etpinardplotlyjs finance sos deprecated plotlyjs from github.com
 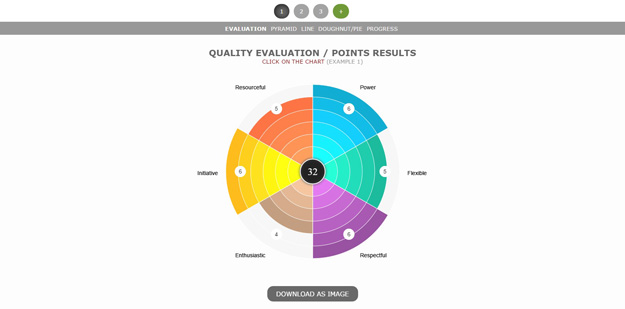 625×309 jquery chart graph plugins code geekz from codegeekz.com
  550×350 jquery graph chart plugins examples designmaz from designsmaz.com
  750×315 jquery data graph sourcecodester from www.sourcecodester.com